

Dashboard
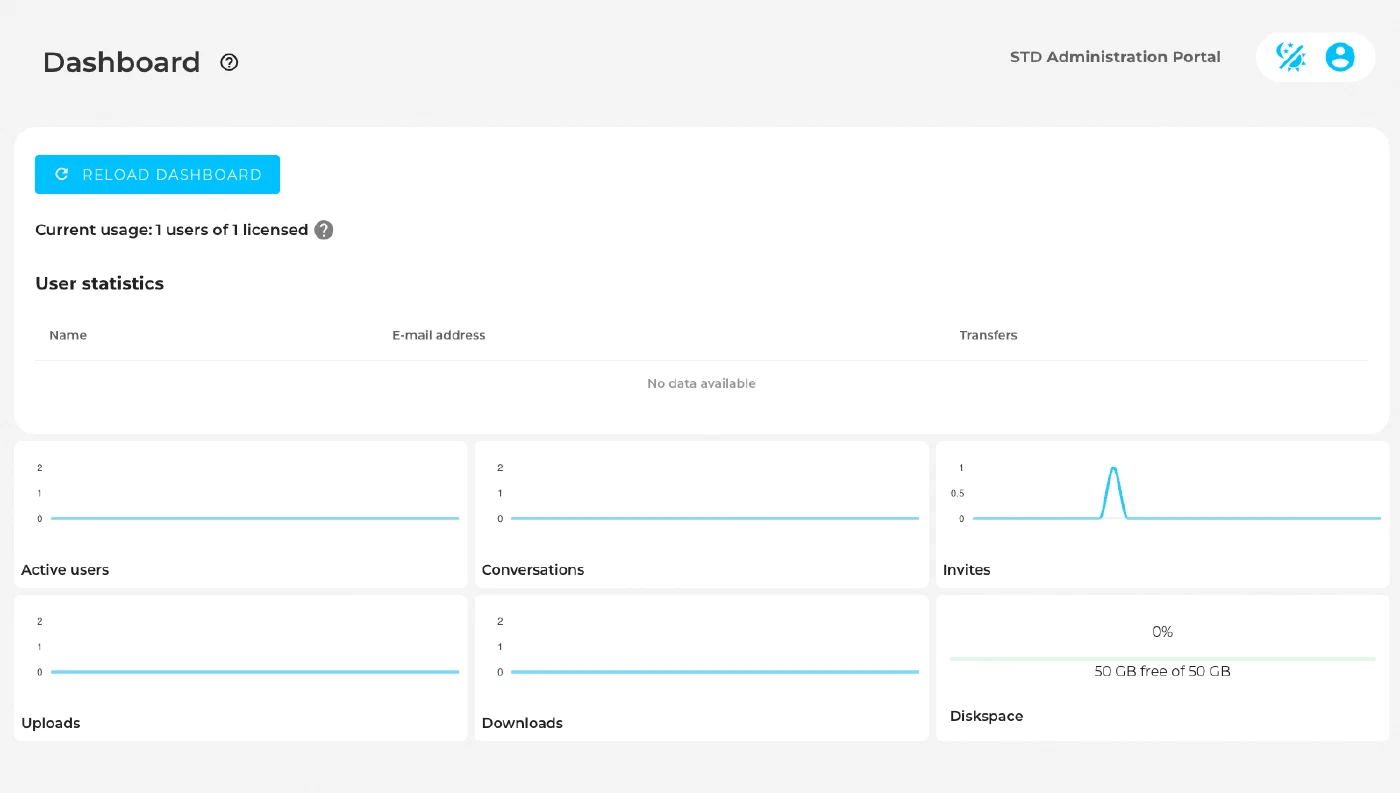
The FileCap dashboard is the screen the customer sees when logging in to the FileCap administration portal, and shows the following information:
- User statistics
This shows the 3 users with the most transfers in the recent period. - Graph with the number of active users.
- Graph with the number of conversations.
- Graph with the number of invites.
- Graph with the number of uploads.
- Graph with the number of downloads.
- If a disk space limit has been set, a graph with free disk space is also shown.
When logged in on an STD-server or as an MSP admin, additional information about the FileCap server status is visible:
- A graph with processor (CPU) usage.
- A graph with memory usage.
- A graph with disk space.
- NTP status
It is checked whether the NTP server configured on the server is reachable. - SMTP status
It is checked whether the configured mail server is reachable. - HTTP status
It is checked whether the server can connect to the internet via HTTP. - HTTPS status
It is checked whether the server can connect to the internet via HTTPS. - DNS status
It is checked whether the DNS servers configured on the server are reachable. - License validity
- Server version
If one of the status indicators shows an error, check the FileCap server firewall rules.